2023 NextJS web dashboard setup
July 2023
NextJS is the swiss knife of the full-stack web developer. Fresh, intuitive and up to date, the NextJS framework provides a fast way to develop modern Progressive Web Apps(PWA).
In this post we will go through a very brief overview of NextJS and some components for a basic dashboard layout. Then to quick setup of GraphQL API on NextJS. And, at the end, some tests with Jest and Playwright.
All the code for this post is available at https://github.com/arthurstomp/nextjs_dashboard_demo
NextJS Overview
.
├── next.config.js
├── next-env.d.ts
├── package.json
├── package-lock.json
├── postcss.config.js
├── public
├── README.md
├── src
│   ├── pages
│   │   ├── api
│   │   │   ├── hello.ts
│   │   ├── _app.tsx
│   │   ├── dashboard_demo.tsx
│   │   ├── _document.tsx
│   │   └── index.tsx
│   ├── styles
├── tailwind.config.js
└── tsconfig.json
NextJS has a few conventions regarding src/pages. The framework infers its http routes from the folder structure in src/pages. In other words:
- the
JSX.Elementdefault export ofsrc/pages/about.tsxis rendered athttp://localhost:3000/about; src/pages/blog/post_test.tsxis rendered athttp://localhost:3000/blog/post_test.
Files and directories named with square brackets around its name defines a dynamic segment in the URL, a variable from the URL that can be used to render the page - src/pages/user/[id].tsx is rendered as http://localhost:3000/user/1, 1 is assigned to the id variable and is accessible at the page component.
src/pages/api works similarly but instead of file’s default export being a JSX.Element, it exports a handler function with format (req: NextApiRequest, res: NextApiResponse<T>): T. This function builds the result returned at api routes - src/pages/api/hello.tsx responds to http://localhost:3000/api/hello
Basic Dashboard Layout
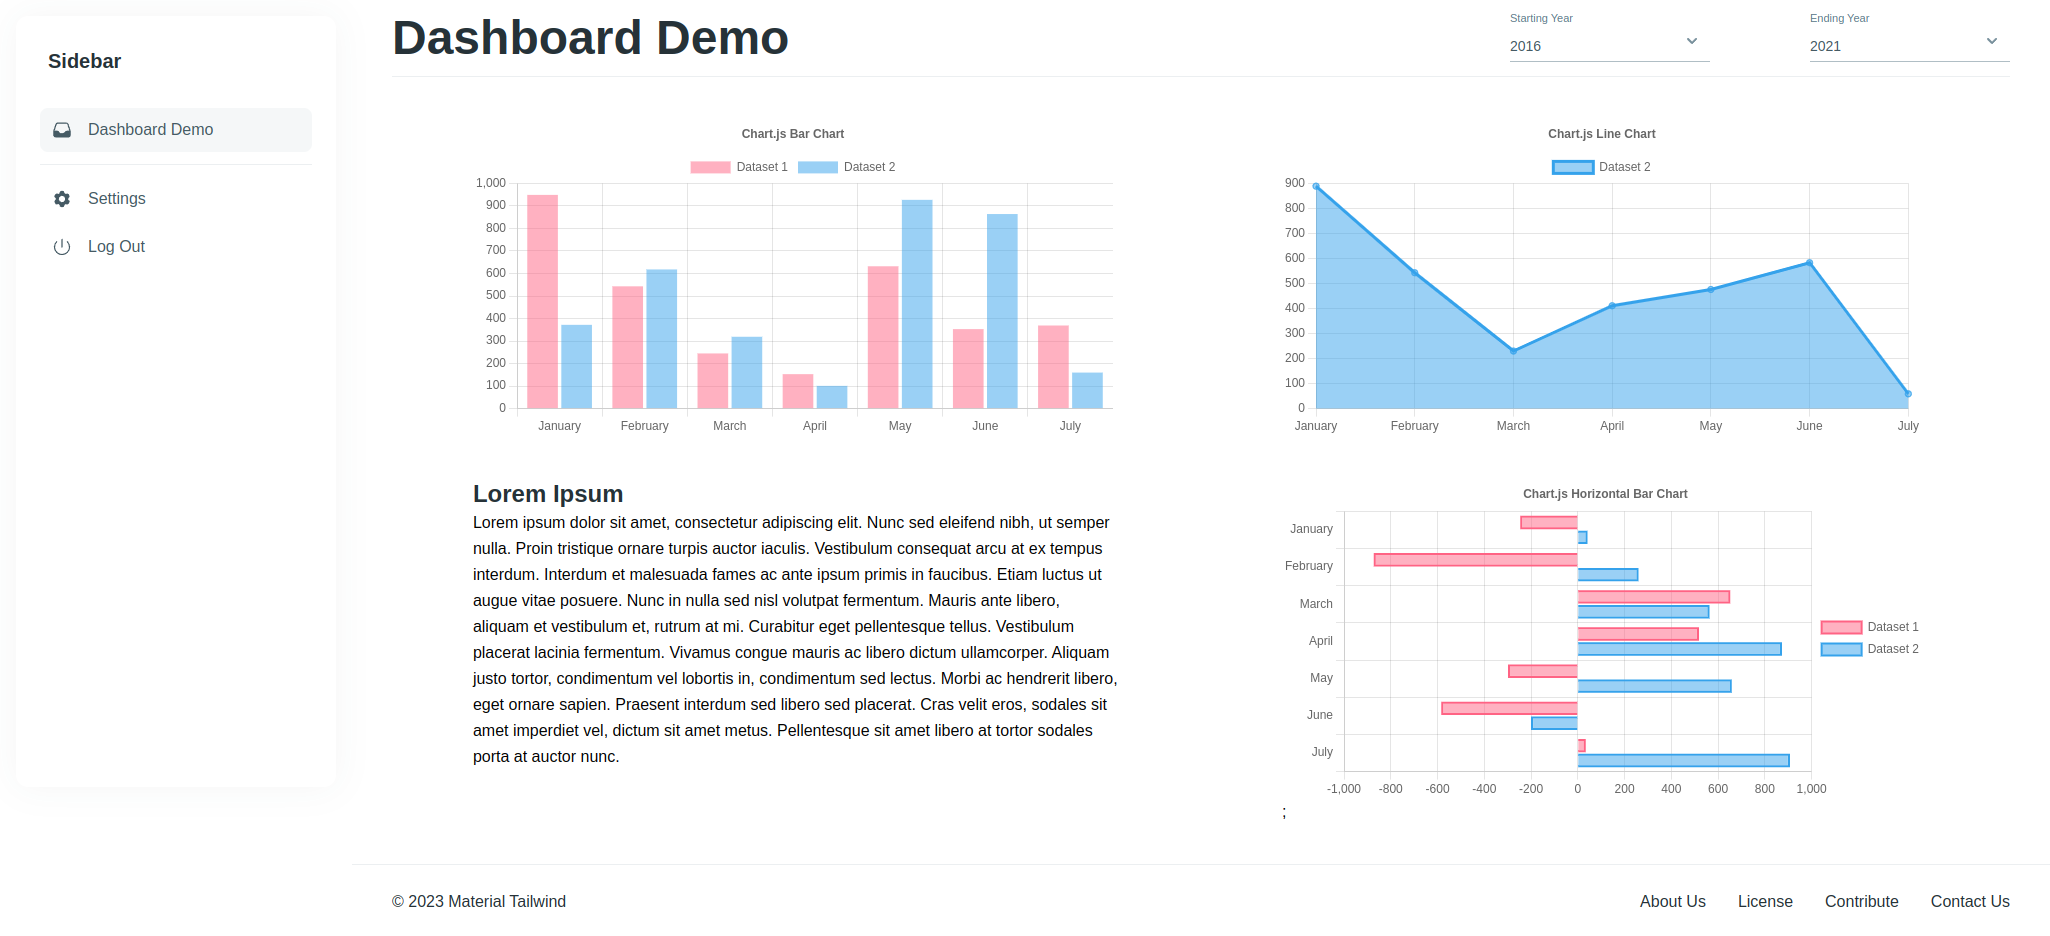
For this draft dashboard we will need a layout for it with a sidebar and some charts, we will be using React-Chart.js for charts. The objective is to get the look below.

For the layout, create a src/layouts/dashboard.tsx.
// src/layouts/dashboard.tsx
import type { PropsWithChildren } from 'react'
import Sidebar from '@/components/sidebar'
import Footer from '@/components/footer'

export default function Layout({ children }: PropsWithChildren) {
  return (
    <>
      <div className="flex h-full">
        <Sidebar />
        <main className="w-full">
          {children}
          <Footer></Footer>
        </main>
      </div>
    </>
  )
}
Sidebar component - src/components/sidebar.tsx
// src/components/sidebar.tsx
import React from "react";
import {
  Card,
  Typography,
  List,
  ListItem,
  ListItemPrefix,
} from "@material-tailwind/react";
import {
  Cog6ToothIcon,
  InboxIcon,
  PowerIcon,
} from "@heroicons/react/24/solid";
import Link from 'next/link'
import { useRouter } from 'next/router'

export default function Sidebar() {
  const router = useRouter()

  return (
    <div className="static w-1/5 min-w-[22rem]">
      <Card className="fixed top-4 left-4 h-[calc(100vh-2rem)] w-full max-w-[20rem] p-4 shadow-[0_0_35px_0_rgba(0,0,0,0.3)] shadow-blue-gray-900/5">
        <div className="mb-2 p-4">
          <Link href="/" className={`${router.pathname === '/' ? "pointer-events-none" : ""}`} data-testid="sidebar__header">
            <Typography variant="h5" color="blue-gray">
              Sidebar
            </Typography>
          </Link>
        </div>
        <List>
          <Link href="/dashboard_demo" className={`${router.pathname === '/dashboard_demo' ? "pointer-events-none" : ""}`} data-testid="sidebar__item--dashboard">
            <ListItem selected={router.pathname === '/dashboard_demo'}>
              <ListItemPrefix>
                <InboxIcon className="h-5 w-5" />
              </ListItemPrefix>
              Dashboard Demo
            </ListItem>
          </Link>
          <hr className="my-2 border-blue-gray-50" />
          <ListItem>
            <ListItemPrefix>
              <Cog6ToothIcon className="h-5 w-5" />
            </ListItemPrefix>
            Settings
          </ListItem>
          <ListItem>
            <ListItemPrefix>
              <PowerIcon className="h-5 w-5" />
            </ListItemPrefix>
            Log Out
          </ListItem>
        </List>
      </Card>

    </div>
  );
}
To apply this new layout to the application, alter the src/pages/_app.tsx to look like the code below
// import "@/styles/globals.css";
import type { AppProps } from "next/app";
import { ThemeProvider } from "@material-tailwind/react";
import DashboardLayout from '@/layouts/dashboard'

export default function App({ Component, pageProps }: AppProps) {
  return (
    <ThemeProvider>
      <DashboardLayout>
        <Component {...pageProps} />
      </DashboardLayout>
    </ThemeProvider>
  );
}
With that you will be able to visit http://localhost:3000/ and see the layout with the dashboard.
So far we don’t have a page to display the demo of our dashboard. For that create a new page - src/pages/dashboard_demo.tsx. As we don’t have an API yet, so lets use some random charts from React-Chart-JS examples for the moment.
// src/pages/dashboard_demo.tsx

import React, { createContext, useState } from 'react'
import { Typography } from "@material-tailwind/react"
import RandomVerticalBarChart from "@/components/random_vertical_bar_chart"
import RandomHorizontalBarChart from '@/components/random_horizontal_bar_chart'
import RandomAreaChart from '@/components/random_area_chart'
import { Select, Option } from "@material-tailwind/react";

function LoremText() {
  return(
    <>
      <Typography variant="h4" color="blue-gray">
        Lorem Ipsum
      </Typography>
      <Typography>
        Lorem ipsum dolor sit amet, consectetur adipiscing elit. Nunc sed eleifend nibh, ut semper nulla. Proin tristique ornare turpis auctor iaculis. Vestibulum consequat arcu at ex tempus interdum. Interdum et malesuada fames ac ante ipsum primis in faucibus. Etiam luctus ut augue vitae posuere. Nunc in nulla sed nisl volutpat fermentum. Mauris ante libero, aliquam et vestibulum et, rutrum at mi. Curabitur eget pellentesque tellus. Vestibulum placerat lacinia fermentum. Vivamus congue mauris ac libero dictum ullamcorper. Aliquam justo tortor, condimentum vel lobortis in, condimentum sed lectus. Morbi ac hendrerit libero, eget ornare sapien. Praesent interdum sed libero sed placerat. Cras velit eros, sodales sit amet imperdiet vel, dictum sit amet metus. Pellentesque sit amet libero at tortor sodales porta at auctor nunc.
      </Typography>
    </>
  )
}

const FIRST_YEAR = 1961
const LAST_YEAR = 2021

const yearOptions = (keyPrefix: string): JSX.Element[] => {
  let buf: JSX.Element[] = []
  for (let i = LAST_YEAR; i >= FIRST_YEAR; i--) {
    buf.push(<Option key={`${keyPrefix}-option-${i}`} value={i.toString()}>{i}</Option>)
  }

  return buf
}

export type YearRangeContextValue = {
  startingYear: number,
  endingYear: number,
}

export const YearRangeContext = createContext<YearRangeContextValue>({
  startingYear: 2016,
  endingYear: 2021
})

export default function DashboardDemo() {
  const [startingYear, setStartingYear] = useState<number>(2016)
  const [endingYear, setEndingYear] = useState<number>(2021)
  return(
    <>
      <YearRangeContext.Provider value=>
        <div className="pt-2 w-full px-10">
          <div className="flex justify-between">
            <div>
              <Typography variant="h1" color="blue-gray">
                Dashboard Demo
              </Typography>
            </div>
            <div className="flex pt-[10px] justify-between min-w-[500px]">
              <div>
                <Select
                  variant="standard"
                  label="Starting Year"
                  value={startingYear.toString()}
                  onChange={(newValue) => setStartingYear(parseInt(newValue || '0'))}>
                  {yearOptions('starting-year')}
                </Select>
              </div>
              <div>
                <Select
                  variant="standard"
                  label="Ending Year"
                  value={endingYear.toString()}
                  onChange={(newValue) => setEndingYear(parseInt(newValue || '0'))}>
                  {yearOptions('ending-year')}
                </Select>
              </div>
            </div>
          </div>
          <hr className="hidden my-2 border-blue-gray-50" />
          <hr className="my-2 border-blue-gray-50" />
          <section className="max-w-[100%] my-10 flex justify-around flex-wrap">
            <div className="w-2/5">
              <RandomVerticalBarChart/>
            </div>
            <div className="w-2/5">
              <RandomAreaChart />
            </div>
          </section>
          <section className="max-w-[100%] my-10 flex justify-around flex-wrap">
            <div className="w-2/5">
              <LoremText />
            </div>
            <RandomHorizontalBarChart className="w-2/5" />
          </section>
        </div>

      </YearRangeContext.Provider>
    </>
  )
}
Once that page is in place we can go to http://localhost:3000/dashboard_demo and see the random charts being rendered.

NextJS + GraphQL
For simple cases, REST-like routes may suffice. But in the case of this little project, a dashboard for displaying charts, where a new chart might require a slightly different API endpoint it makes sense to make use of the flexibility of the GraphQL.
For the GraphQL server we will be using Apollo’s GraphQL server. Let’s go ahead and install the GraphQL dependencies.
$ npm i --save @apollo/server @as-integrations/next graphql graphql-request graphql-tag
A GraphQL server requires two basic elements: the definition of the types of data and requests(queries and mutations) that are accepted by the API, and the resolver object containing the implementation for the requests defined in the type definition. Lets create two files to represent those elements - ‘src/pages/api/schema/index.ts’ for the type definitions, and src/pages/api/resolvers/index.ts for the resolver object.
For the sample app we will be using some indicators from World Bank data portal found at HDX. Those indicators are kept in csv files used in the resolver.
// src/pages/api/schema/index.ts
import { gql } from 'graphql-tag';

export const typeDefs = gql`
type WorldBankDSLine {
  country_name: String
  country_iso_code: String
  year: String
  indicator_name: String
  indicator_code: String
  value: Float
  unity: String
}

type Query {
  getWorldBankIndicators(country_iso_code: String!, indicator_code: String!, year: String): [WorldBankDSLine]
}
`
// src/pages/api/resolver/index.ts
import { promises as fs } from 'fs';
import * as path from 'path';

const chinaIndicatorsFilePath = path.join(process.cwd(), 'src/assets/graphql/world_bank_indicators/world_bank_indicators_chn.json')
const indiaIndicatorsFilePath = path.join(process.cwd(), 'src/assets/graphql/world_bank_indicators/world_bank_indicators_ind.json')

export const resolvers = {
  Query: {
    getWorldBankIndicators: async (_: never, args: any) => {
      try {
        let choosenFilePath

        if (args.country_iso_code === 'CHN') {
          choosenFilePath = chinaIndicatorsFilePath
        } else {
          choosenFilePath = indiaIndicatorsFilePath
        }

        const file = await fs.readFile(choosenFilePath, { encoding: 'utf-8'})
        if (file) {
          const indicatorsJson = JSON.parse(file)
          const data = indicatorsJson.data
          const filteredData = data.filter((d: any) => {
            return d.IndicatorCode === args.indicator_code
          })

          return filteredData.map((d: any) => ({
            country_name: d.CountryName,
            country_iso_code: d.CountryISO3,
            year: d.Year,
            indicator_name: d.IndicatorName,
            indicator_code: d.IndicatorCode,
            value: d.Value
          }))
        } else {
          return []
        }
      } catch (error) {
        throw error;
      }
    }
  }
};
With those two modules we can go ahead and create the GraphQL API endpoint with src/pages/api/graphql.ts
import { ApolloServer } from '@apollo/server';
import { startServerAndCreateNextHandler } from '@as-integrations/next';

import { typeDefs } from './schemas'
import { resolvers } from './resolvers'

const server = new ApolloServer({
  resolvers,
  typeDefs,
});

export default startServerAndCreateNextHandler(server);
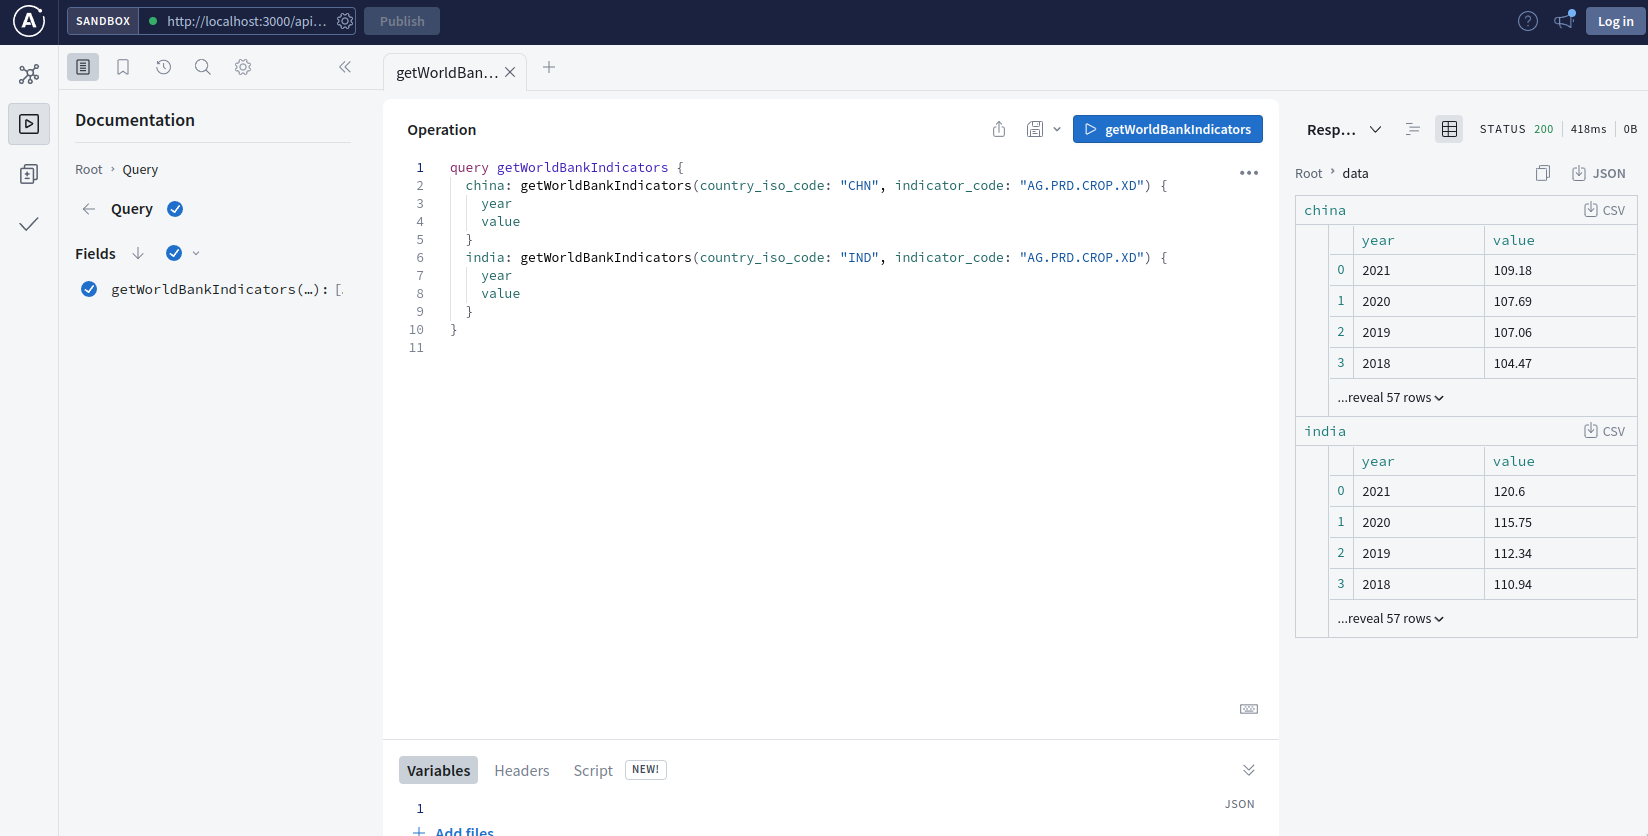
With those files in place we are able to visit http://localhost:3000/api/graphql and view Apollo’s GraphQL console.

Connect charts to API
Now that we’ve got both front-end and back-end in place is time to connect them together. First thing we need is a client for our GraphQL API.
//src/utils/world_bank_client.ts

import { request, gql } from 'graphql-request'

export const buildQuery = (countryCode: string, indicatorCode: string, startingYear: string, endingYear: string) => (
  gql`
  {
    ${countryCode}: getWorldBankIndicators(country_iso_code: "${countryCode}", indicator_code: "${indicatorCode}", starting_year: "${startingYear}", ending_year: "${endingYear}") {
      year
      value
    }
  }
  `
)

function compareYear(a: any, b: any) {
  const aYearInt = parseInt(a.year)
  const bYearInt = parseInt(b.year)

  if (aYearInt > bYearInt) {
    return 1
  }

  if (aYearInt < bYearInt) {
    return -1
  }
  return 0
}

export type ProtoDataset = {
  labels: string[]
  data: number[]
}

function resultToProtoDataset(result: any[]) {
  let buf: ProtoDataset = {
    labels: [],
    data: []
  }
  result.forEach((res: any) => {
    if (!buf.labels.includes(res.year)) {
      buf.labels.push(res.year)
      buf.data.push(res.value)
    }
  })

  return buf
}

export const fetcher = async ([countryCode, indicatorCode, startingYear, endingYear]: string[]) => {
  let res = await request('/api/graphql', buildQuery(countryCode, indicatorCode, startingYear, endingYear))
  res = (res as any)[countryCode]
  res = (res as any[]).sort(compareYear)
  return resultToProtoDataset(res as any[])
}
With the fetcher function exported by world_bank_client and the YearRangeContext defined at src/pages/dashboard_demo.tsx we can copy the existing random charts into “real” chart components. Below is an example of how the vertical bar chart is implemented when connected to the API.
import React, { useState, useEffect, PropsWithoutRef, useContext } from 'react';
import {
  Chart as ChartJS,
  CategoryScale,
  LinearScale,
  BarElement,
  Title,
  Tooltip,
  Legend,
} from 'chart.js';
import { Bar } from 'react-chartjs-2';
import useSWR from 'swr'
import { fetcher } from '@/utils/world_bank_client'

ChartJS.register(
  CategoryScale,
  LinearScale,
  BarElement,
  Title,
  Tooltip,
  Legend
);

import { YearRangeContext } from '@/pages/dashboard_demo'

export const options = {
  responsive: true,
  plugins: {
    legend: {
      position: 'top' as const,
    },
    title: {
      display: true,
      text: 'Crop production index (2014-2016 = 100)',
    },
  },
};

export default function VerticalBarChart({className: wrapperClassName}: PropsWithoutRef<any>): JSX.Element {
  const [labels, setLabels] = useState<string[]>([])
  const [chinaDataset, setChinaDataset] = useState<number[]>([])
  const [indiaDataset, setIndiaDataset] = useState<number[]>([])
  const { startingYear, endingYear } = useContext(YearRangeContext)
  const { data: dataChn , error: errorChn } = useSWR(['CHN', "AG.PRD.CROP.XD", startingYear, endingYear], fetcher)
  const { data: dataInd , error: errorInd } = useSWR(['IND', "AG.PRD.CROP.XD", startingYear, endingYear], fetcher)

  useEffect(() => {
    setLabels(dataChn?.labels || [])
    setChinaDataset(dataChn?.data || [])
  }, [dataChn])

  useEffect(() => {
    setLabels(dataInd?.labels || [])
    setIndiaDataset(dataInd?.data || [])
  }, [dataInd])

  if (errorChn) {
    console.log(errorChn)
  }

  if (errorInd) {
    console.log(errorInd)
  }
  const data = {
    labels,
    datasets: [
      {
        label: 'China',
        data: chinaDataset,
        backgroundColor: 'rgba(255, 99, 132, 0.5)',
      },
      {
        label: 'India',
        data: indiaDataset,
        backgroundColor: 'rgba(53, 162, 235, 0.5)',
      },
    ],
  };

  return (
    <div className={wrapperClassName} data-testid="chart">
      <Bar options={options} data={data}/>
    </div>
  )
}
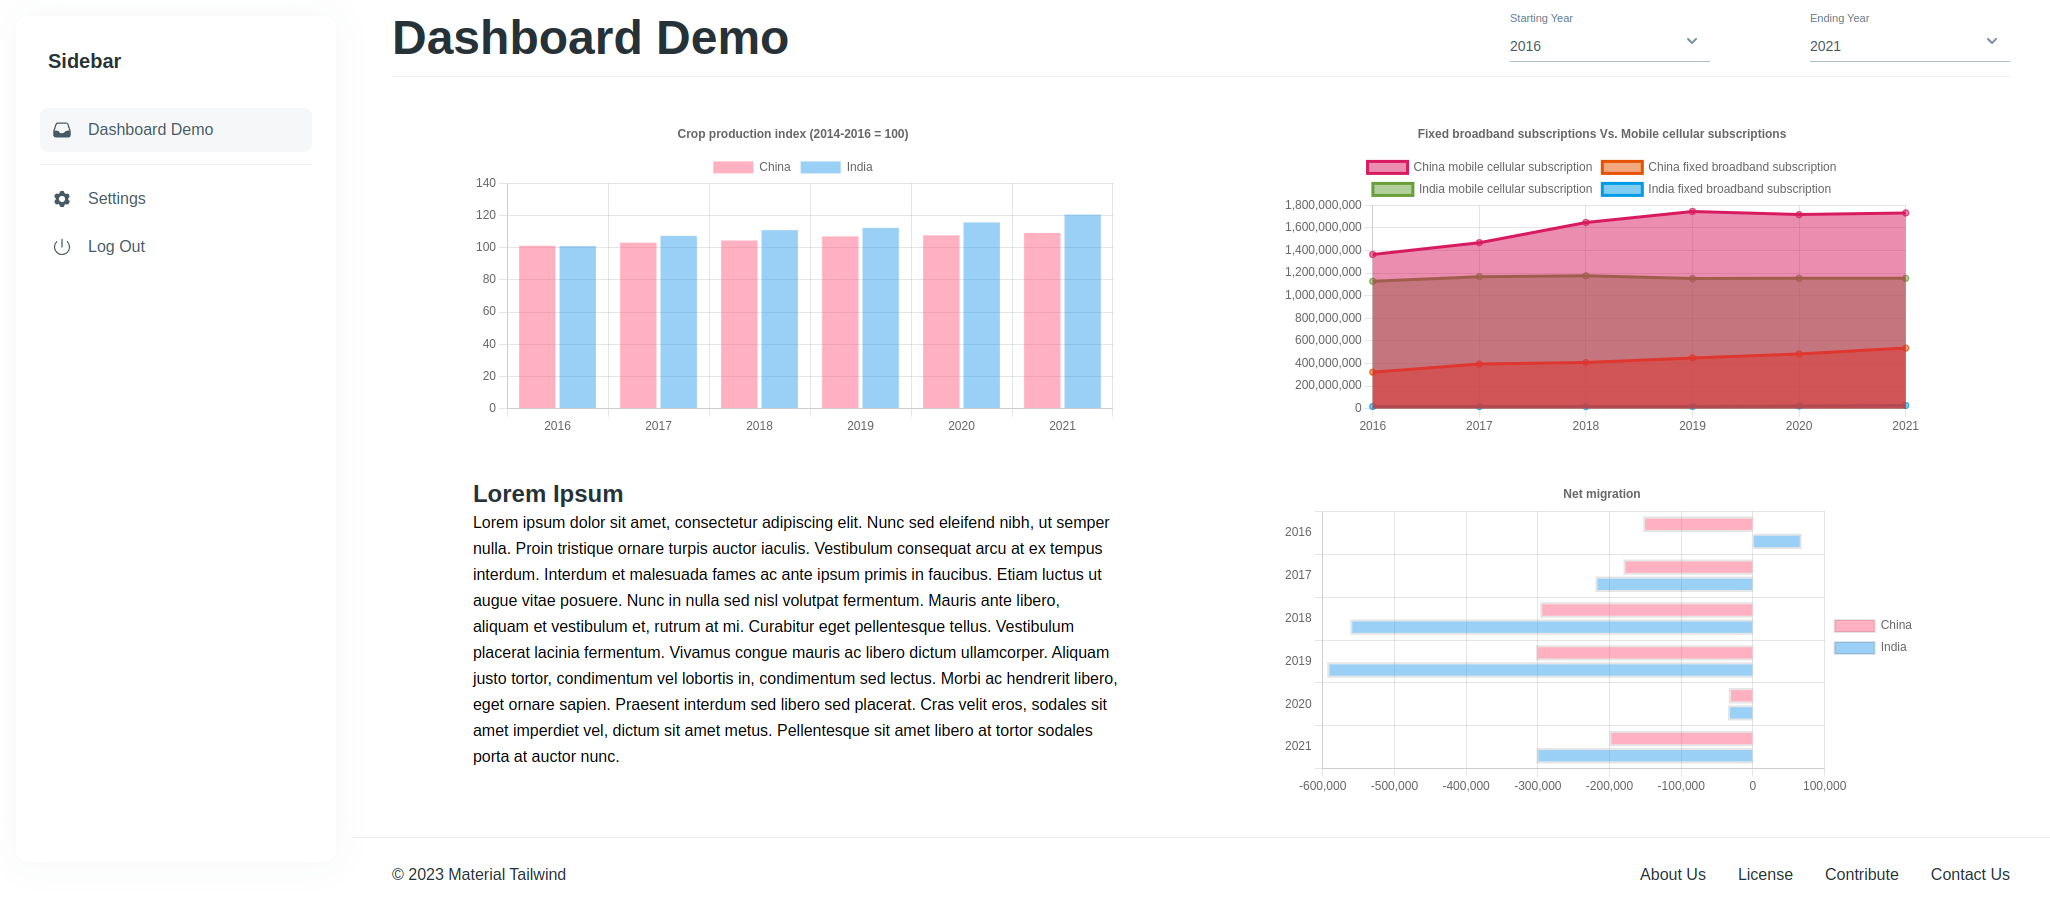
With all the charts converted into “connected” chart we’ve achieved our goal, a sample of functional dashboard with selection of parameter for changing the data displayed by the dashboard.
Now, the final step is set test infrascrutrure to ensure that what is currently working will keep working as the dashboard is the developed and new features are added.
Testing - Jest and Playwright
We will be using 2 test frameworks, Jest for unit and intragration tests, and Playwright for e2e and snapshot tests.
For applications front-end heavy, i personally tend to lean toward more e2e tests that exercise real user use cases then unity coverture.
Snapshot e2e testing is specially important in the case of applications that relly on charts and <canvas> elements, as it’s easier to assert the correct rendering with image snapshoting that by asserting over the <canvas> content.
Below we have an example of a unit test of a chart and the snapshot test of the /dashboard_demo page
// __tests__/vertical_bar_chart.ts
import React from 'react'
import VerticalBarChart from "@/components/vertical_bar_chart";
import { render } from "./test-utils";
import '@testing-library/jest-dom'
import { SWRConfig } from "swr";

global.ResizeObserver = jest.fn().mockImplementation(() => ({
    observe: jest.fn(),
    unobserve: jest.fn(),
    disconnect: jest.fn(),
}))


jest.mock('@/utils/world_bank_client', () => {
  return({
    __esModule: true,
    fetcher: jest.fn(() => {
      return {
        labels: ['2021'],
        data: []
      }
    })
  })
})

import { fetcher } from '@/utils/world_bank_client'

describe("VerticalBarChart", () => {
  it('calls for world_bank_client', async () => {
    const { findByTestId } = render(
      <SWRConfig value=>
        <VerticalBarChart ></VerticalBarChart>
      </SWRConfig>
    )

    await findByTestId('chart')
    expect(fetcher).toHaveBeenCalled()
  })
})
// e2e/dashboard_demo.spec.ts
import { test, expect } from '@playwright/test';

test('Home center text', async ({ page }) => {
  await page.goto('http://localhost:3000/dashboard_demo');

  expect(await page.getByTestId('page-title').textContent()).toMatch("Dashboard Demo");
  expect(await page.screenshot()).toMatchSnapshot()
});